Indicator Gauge Icon Legend
Legend Colors
Red is bad, green is good, blue is not statistically different/neutral.
Compared to Distribution
 the value is in the best half of communities.
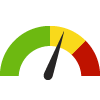 the value is in the 2nd worst quarter of communities.
 the value is in the worst quarter of communities.
Compared to Target
 meets target;
  does not meet target.
Compared to a Single Value
 lower than the comparison value;
 higher than the comparison value;
 not statistically different from comparison value.
Trend

 non-significant change over time;
 significant change over time;
  no change over time.
Compared to Prior Value
 higher than the previous measurement period;
 lower than the previous measurement period;
 no statistically different change from previous measurement period.
 Significantly better than the overall value
 Significantly worse than the overall value
 No significant difference with the overall value
 No data on significance available
Prevalence of Skin Cancer
Measurement Period: 2017
This indicator is archived and is no longer being updated. Click to learn more
This indicator shows the percentage of adults who was ever told by a doctor, nurse or other health professional that they have skin cancer.
Why is this important?
Skin cancer is the abnormal growth of skin cells. It is the most common cancer in the United States. There are three major types of skin cancer — basal cell carcinoma, squamous cell carcinoma and melanoma. Most cases of melanoma, the deadliest kind of skin cancer, are caused by exposure to ultraviolet (UV) light. The risk of skin cancer can be reduced by limiting or avoiding exposure to ultraviolet (UV) radiation such as stay in the shade, use sunscreen, and avoid indoor tanning. Regular inspection of the skin for suspicious changes can help detect skin cancer at its earliest stages. Early detection of skin cancer provides the greatest chance for successful skin cancer treatment.
3.4%
Source:
DC Department of Health Behavioral Risk Factor Surveillance System
Measurement period: 2017
Maintained by: DC Healthy Communities Collaborative
Last update: August 2019
Measurement period: 2017
Maintained by: DC Healthy Communities Collaborative
Last update: August 2019
Compared to


Graph Selections

Data Source
- DC Department of Health Behavioral Risk Factor Surveillance System
Maintained By: DC Healthy Communities Collaborative
Filed under: Health / Cancer