Indicator Gauge Icon Legend
Legend Colors
Red is bad, green is good, blue is not statistically different/neutral.
Compared to Distribution
 the value is in the best half of communities.
 the value is in the 2nd worst quarter of communities.
 the value is in the worst quarter of communities.
Compared to Target
 meets target;
  does not meet target.
Compared to a Single Value
 lower than the comparison value;
 higher than the comparison value;
 not statistically different from comparison value.
Trend

 non-significant change over time;
 significant change over time;
  no change over time.
Compared to Prior Value
 higher than the previous measurement period;
 lower than the previous measurement period;
 no statistically different change from previous measurement period.
 Significantly better than the overall value
 Significantly worse than the overall value
 No significant difference with the overall value
 No data on significance available
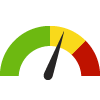
Teens who Felt Unsafe to Attend School
Measurement Period: 2013
This indicator is archived and is no longer being updated. Click to learn more
This indicator shows the percentage of high school students who did not go to school because they felt unsafe at school or on their way to or from school on at least 1 day of the 30 days preceding the survey.
Why is this important?
When students have fears about personal safety at school, or on the way to and from school, they may miss days of class. Perpetrators and victims of school violence are more likely to experience health problems, social and emotional difficulties, and/or poorer academic performance. Moderate to high levels of school violence diminish the likelihood that students will graduate from high school or attend a four-year college. In addition, fear at school can contribute to an unhealthy school climate, and can lead to negative student behaviors. One study found that students who witnessed violence at school were more likely to exhibit violent behaviors. Students who are fearful may also feel they need to protect themselves through actions that can actually increase the likelihood of violence, such as carrying weapons at school.
9.0%
Source:
CDC Youth Risk Behavior Surveillance System
Measurement period: 2013
Maintained by: DC Healthy Communities Collaborative
Last update: November 2014
Measurement period: 2013
Maintained by: DC Healthy Communities Collaborative
Last update: November 2014
Compared to

Graph Selections

Data Source
- CDC Youth Risk Behavior Surveillance System
Maintained By: DC Healthy Communities Collaborative
Filed under: Health / Prevention & Safety, Health / Adolescent Health, Teens