Indicator Gauge Icon Legend
Legend Colors
Red is bad, green is good, blue is not statistically different/neutral.
Compared to Distribution
 the value is in the best half of communities.
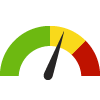 the value is in the 2nd worst quarter of communities.
 the value is in the worst quarter of communities.
Compared to Target
 meets target;
  does not meet target.
Compared to a Single Value
 lower than the comparison value;
 higher than the comparison value;
 not statistically different from comparison value.
Trend

 non-significant change over time;
 significant change over time;
  no change over time.
Compared to Prior Value
 higher than the previous measurement period;
 lower than the previous measurement period;
 no statistically different change from previous measurement period.
 Significantly better than the overall value
 Significantly worse than the overall value
 No significant difference with the overall value
 No data on significance available
Teens with Asthma
Measurement Period: 2013
This indicator is archived and is no longer being updated. Click to learn more
This indicator shows the percentage of high school students who where ever told by a doctor or nurse that they had asthma.
Why is this important?
Asthma in children is a serious public health problem in the US. The National Health Interview Survey has found that persons under 18 years have higher rates of asthma than any other age group. Of particular concern is the significant increase in asthma rates in children since 1980. Asthma in children results in missed days of school, limitations on daily activities, emergency department visits for treatment of asthma symptoms, and hospitalizations.
31.0%
Source:
CDC Youth Risk Behavior Surveillance System
Measurement period: 2013
Maintained by: DC Healthy Communities Collaborative
Last update: November 2014
Measurement period: 2013
Maintained by: DC Healthy Communities Collaborative
Last update: November 2014
Compared to

Graph Selections

Data Source
- CDC Youth Risk Behavior Surveillance System
Maintained By: DC Healthy Communities Collaborative
Filed under: Health / Respiratory Diseases, Health / Adolescent Health, Environmental Health / Toxins & Contaminants, Teens